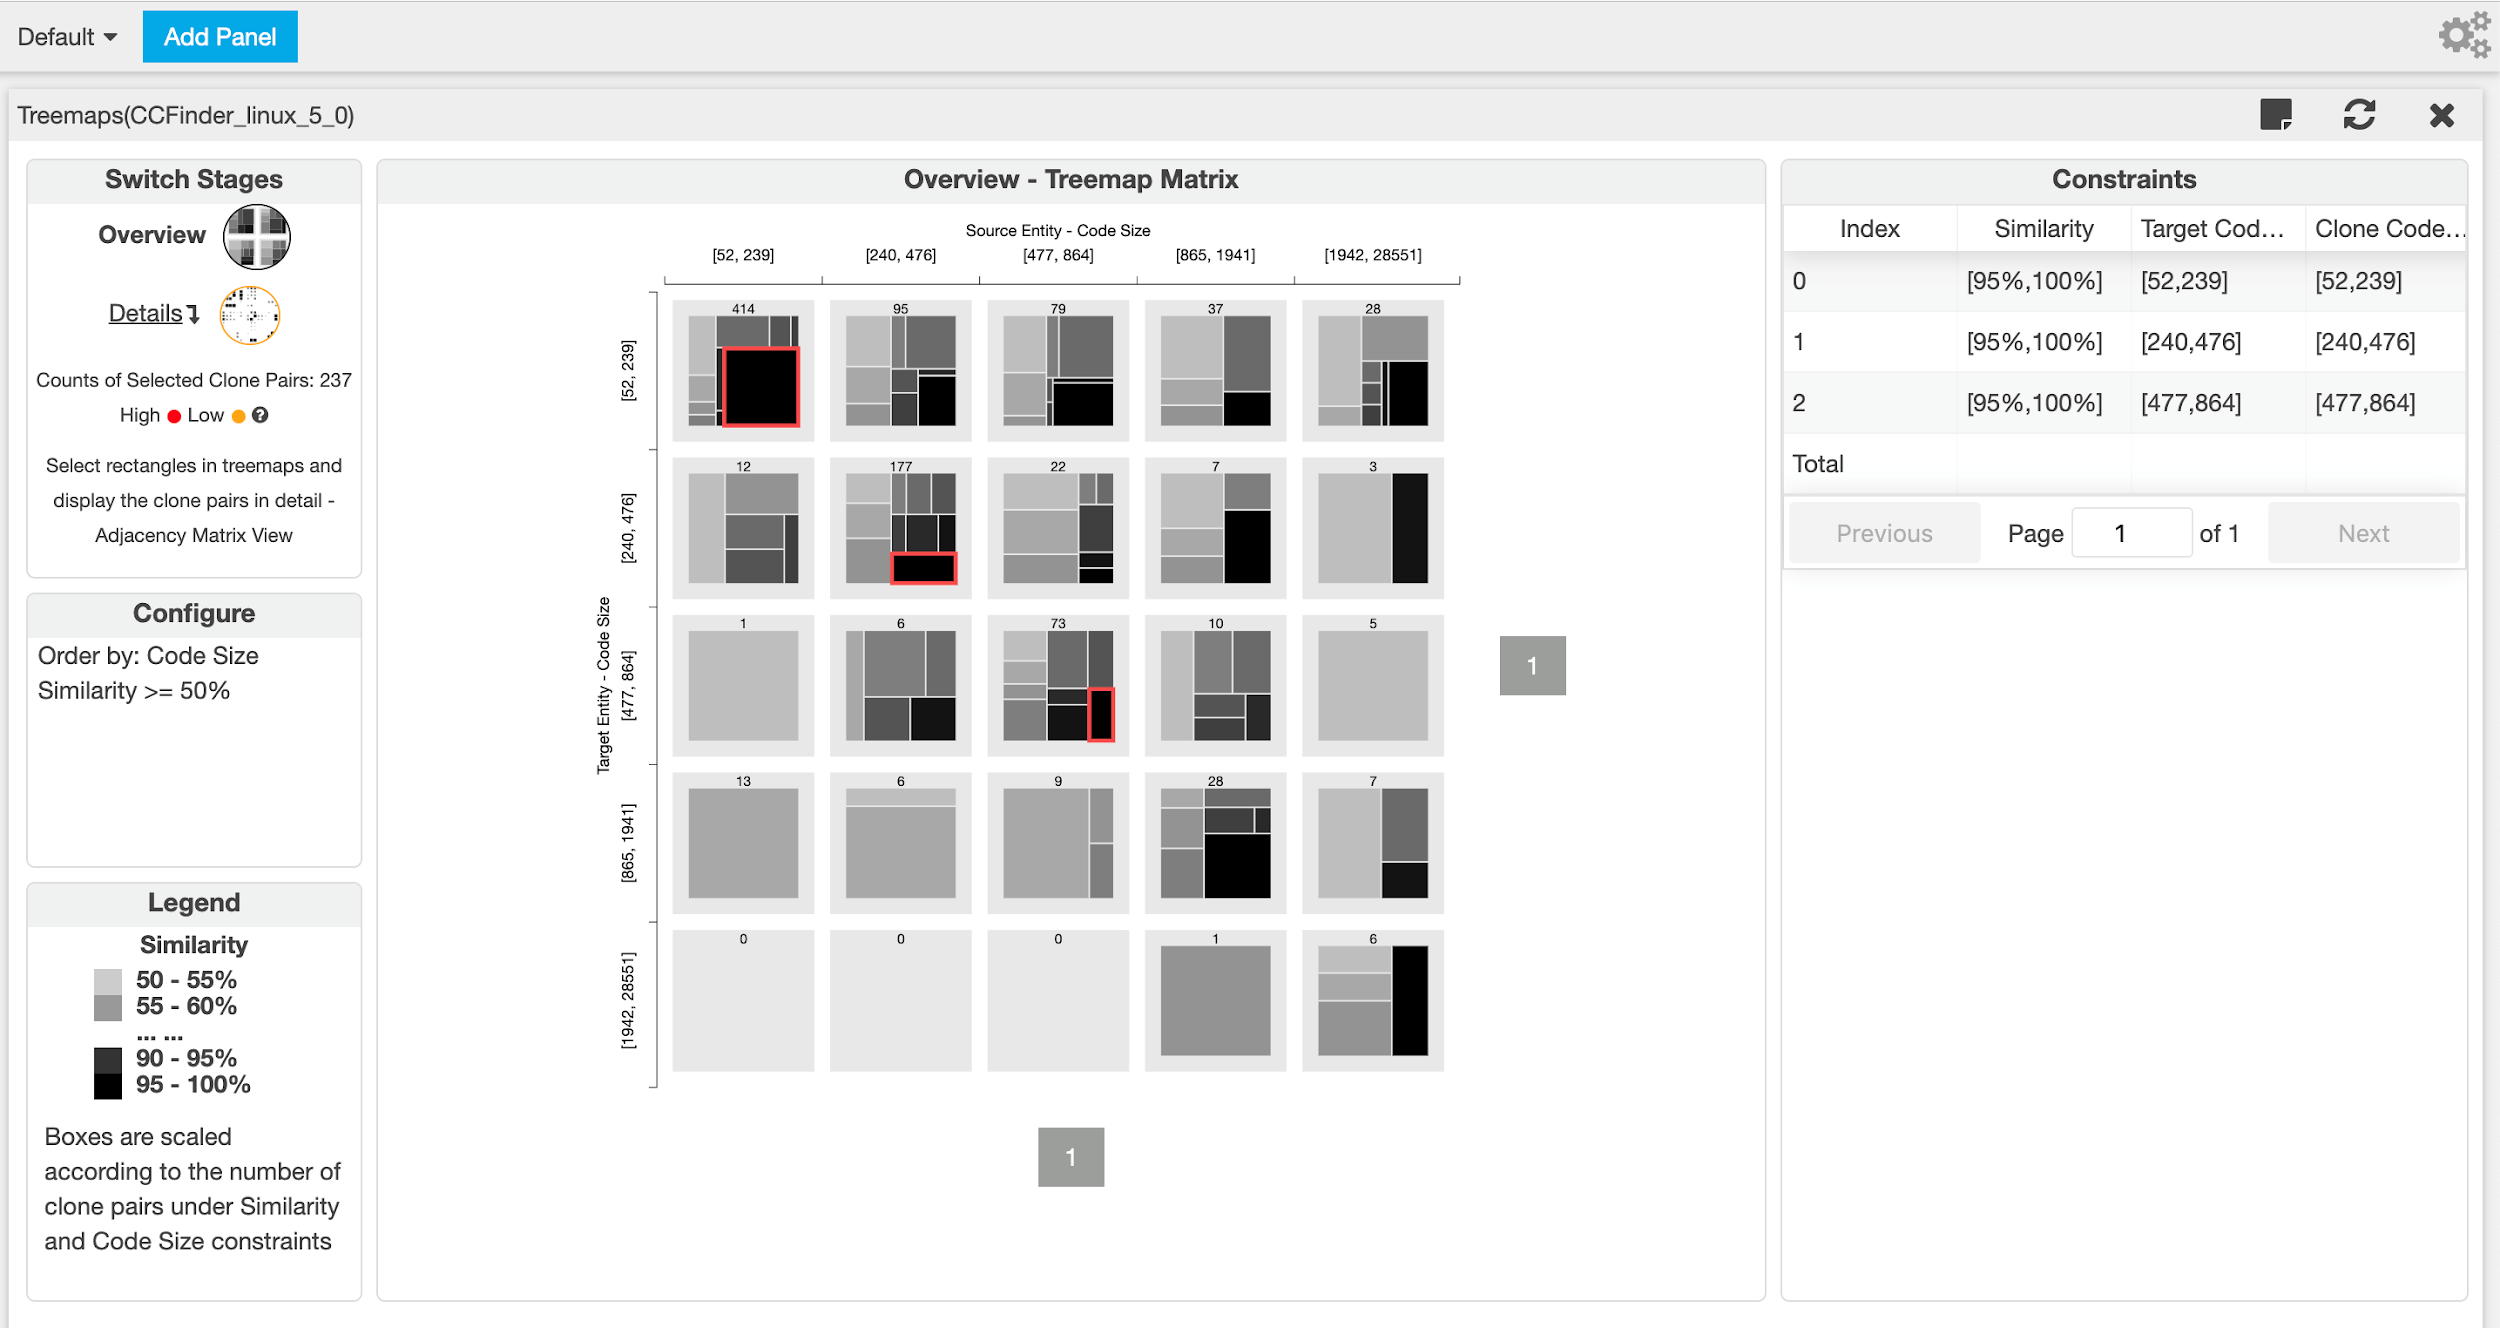
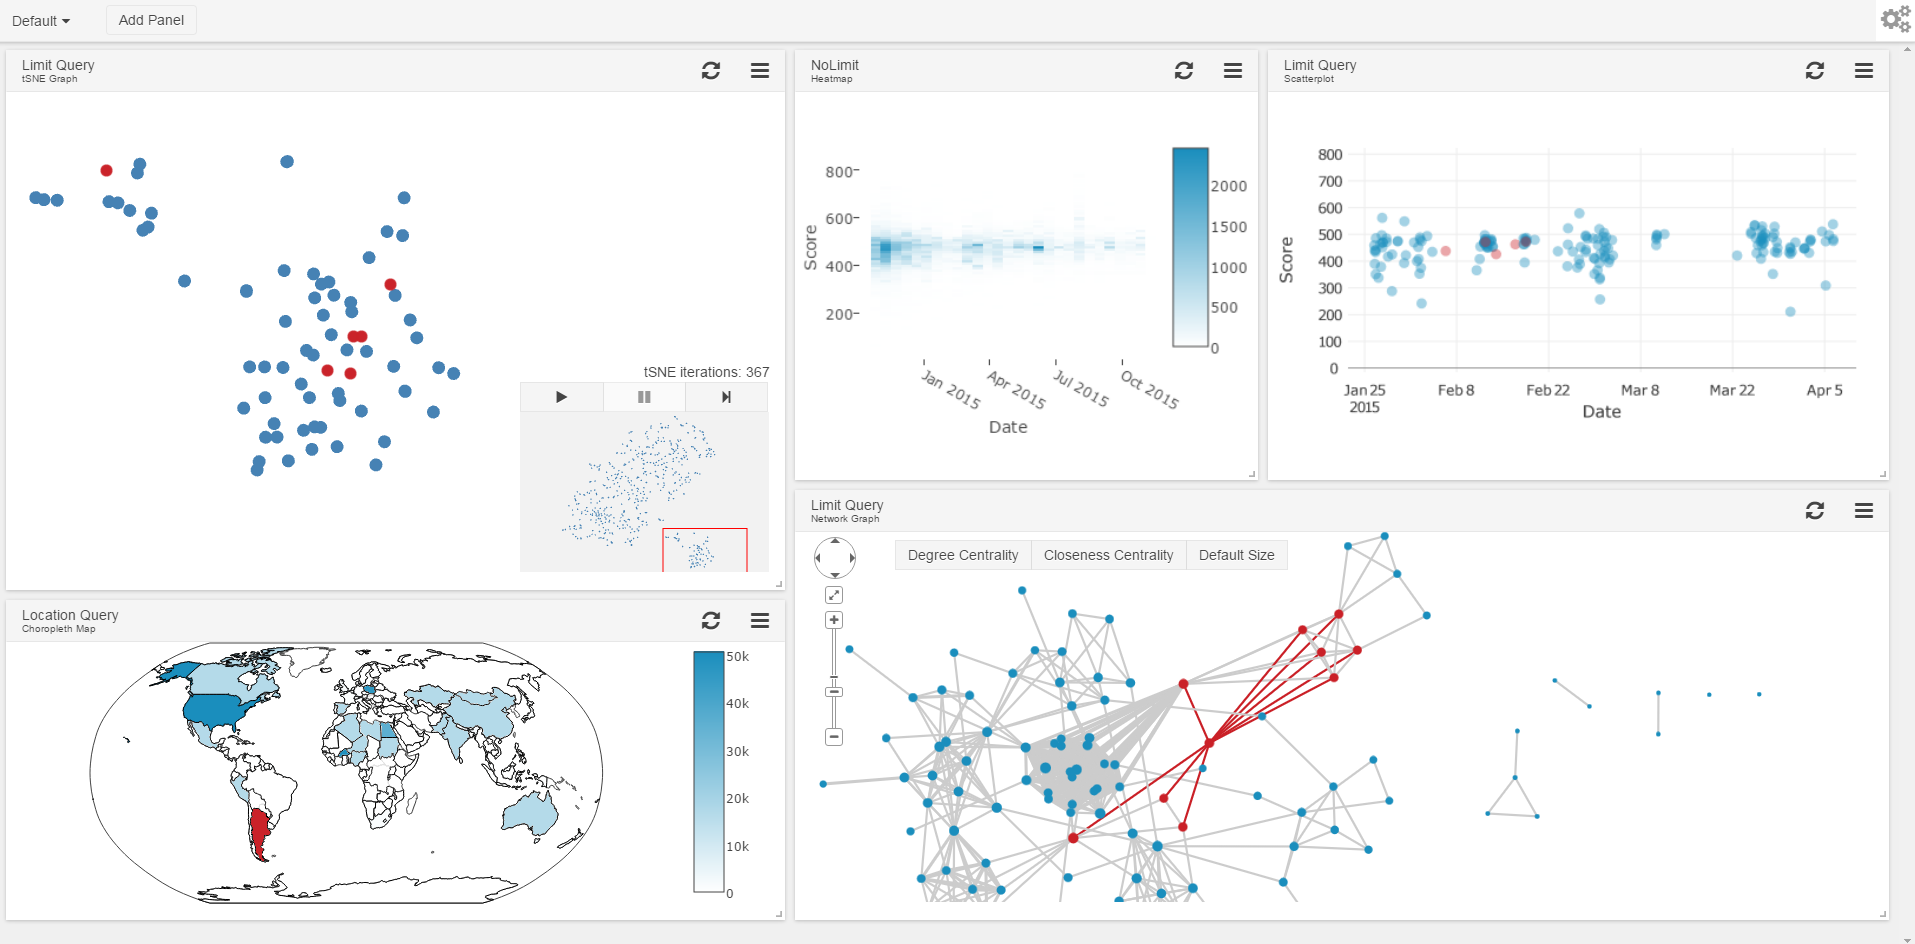
Lodestone
Lodestone is a data exploration tool designed to investigate a variety of data, including the bottom-up analysis of large multifaceted social and conversational datasets.
View Project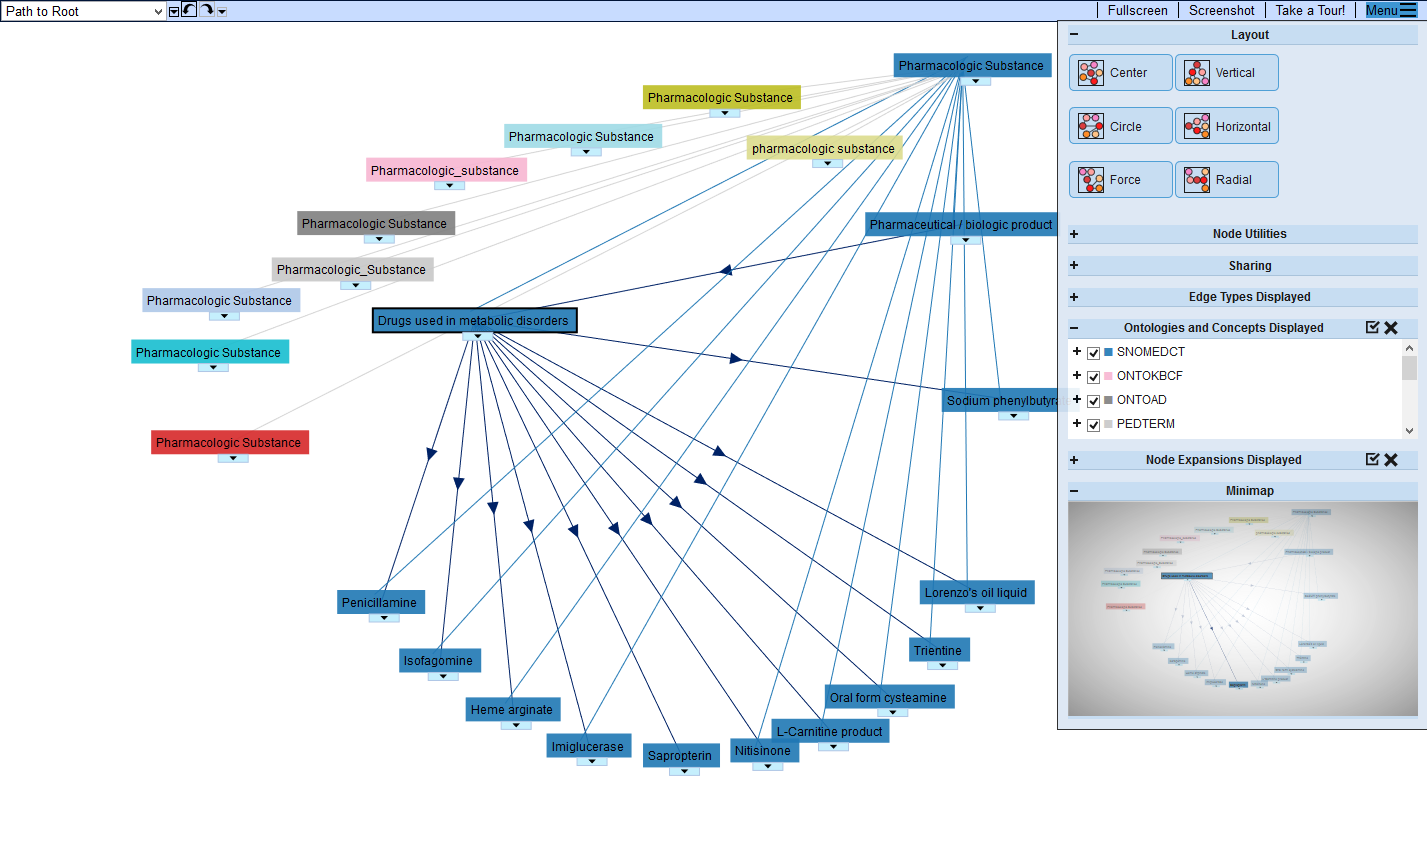
BioMixer
BioMixer is a Web-based environment for visualizing and exploring biomedical ontologies. It is the underlying technology for the visualization components found in BioPortal, the world’s most comprehensive repository of biomedical ontologies.
View Project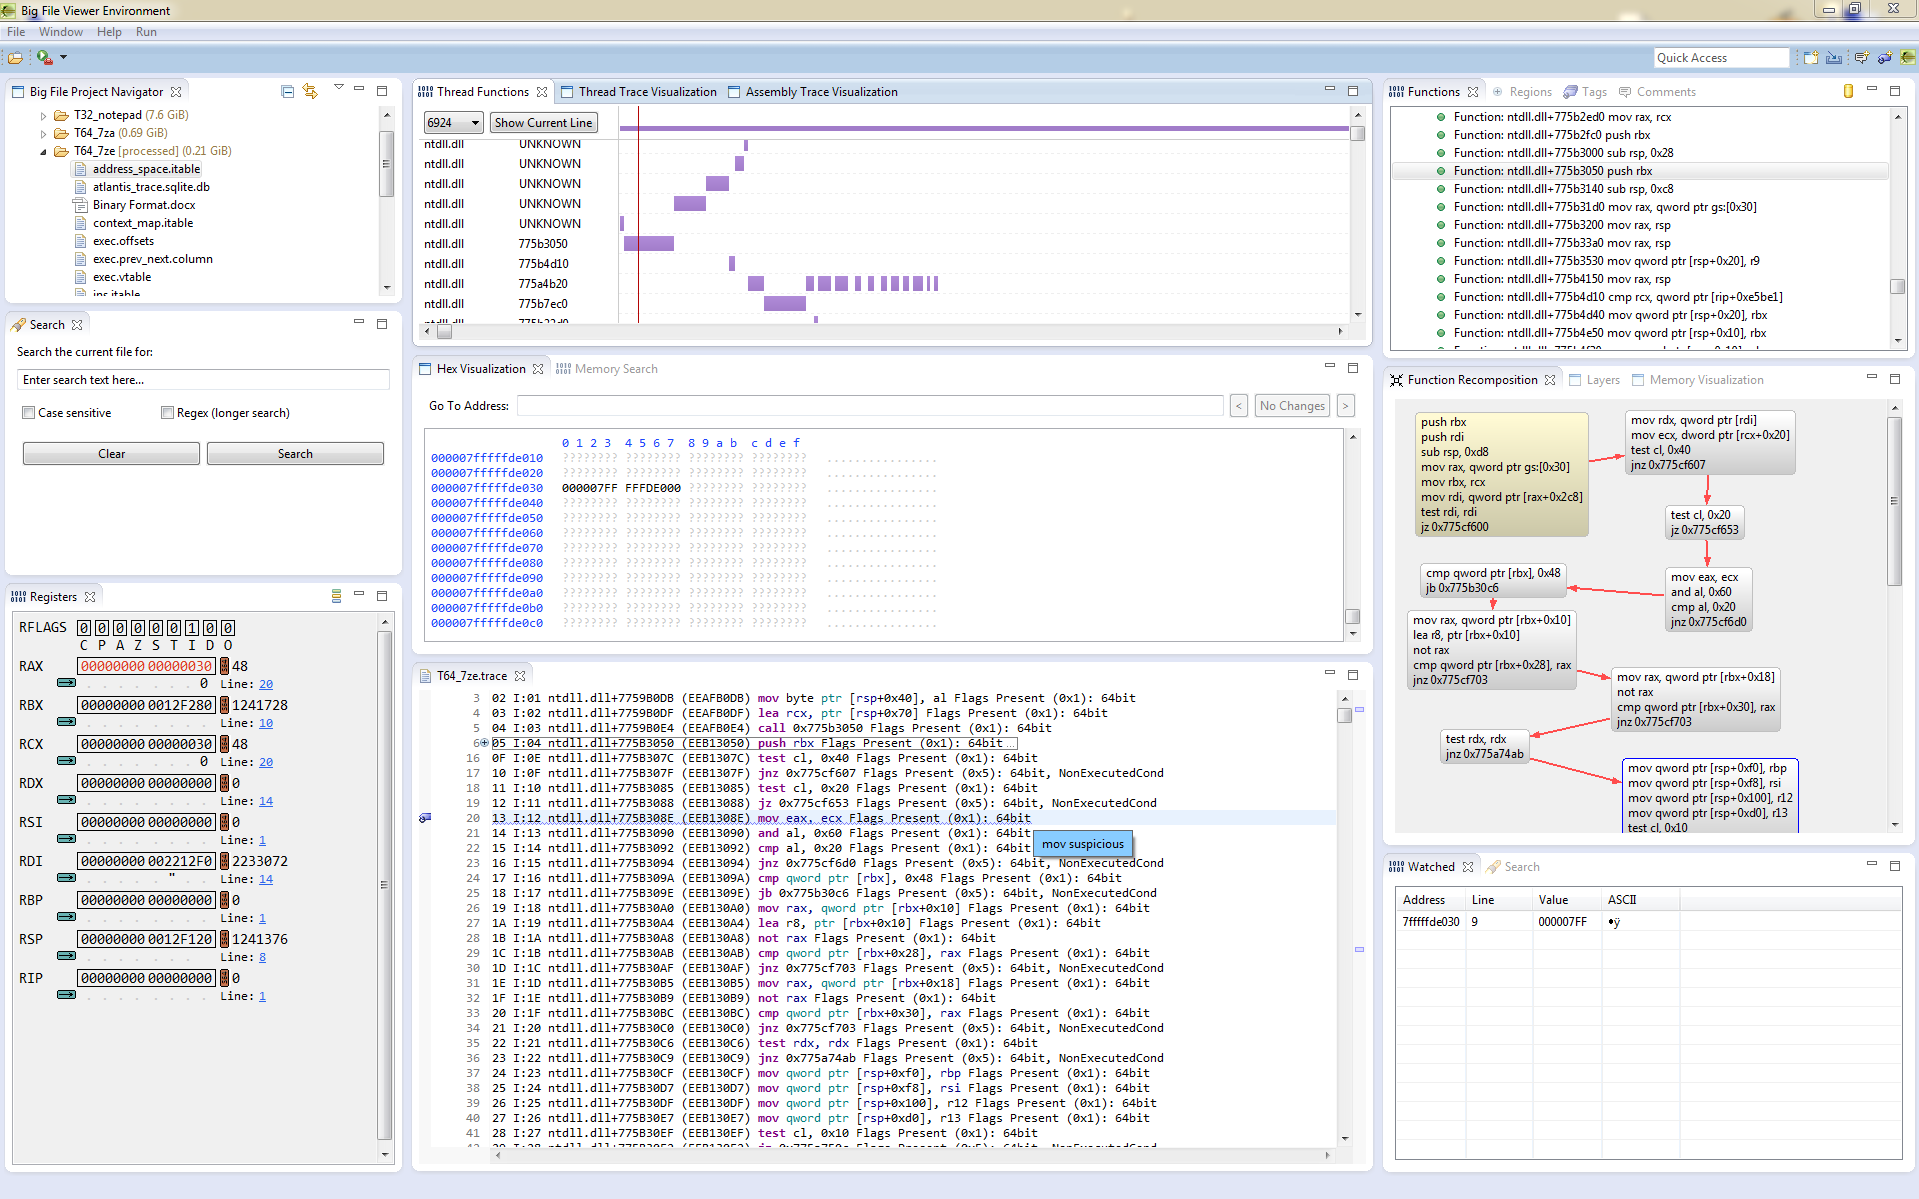
Atlantis
Atlantis is an assembly trace analysis tool built in Eclipse. It provides novel trace annotation and navigation techniques to support software security engineers performing exploitability analysis.
View Project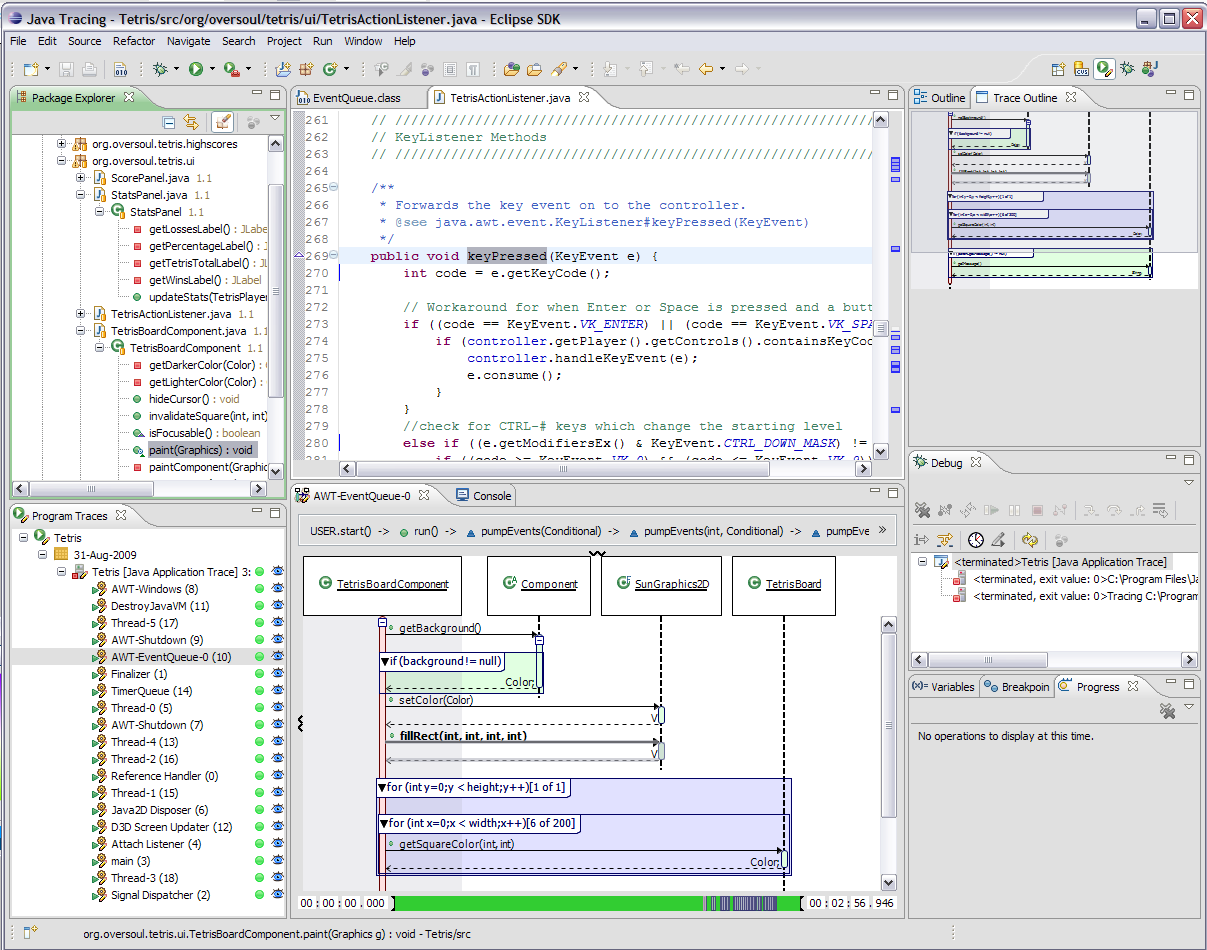
Diver
Diver is a set of tools that enhances the Eclipse IDE. It allows developers to easily trace program execution, filter Eclipse views based on traces, and compare the differences between traces.
View Project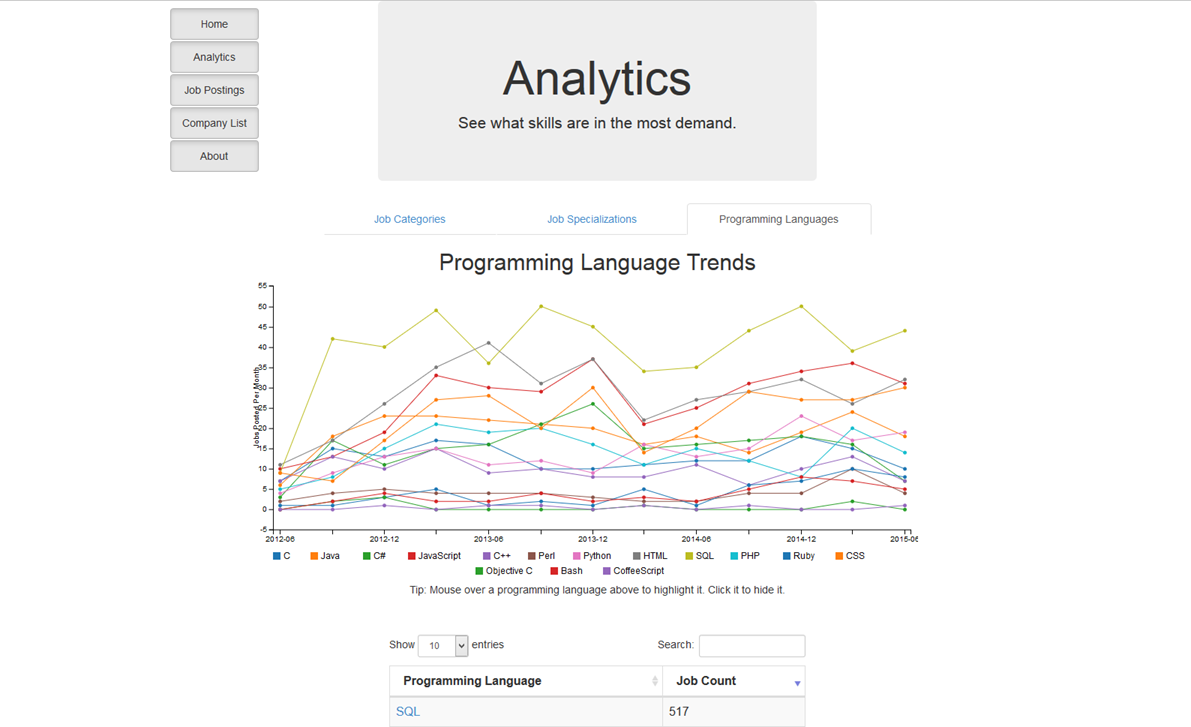
Good Jobs
GoodJobs4U archives job postings from the VIATeC job board for analyses specific to the Victoria, BC job market.
View Project